Projects
University of Iowa OER Cost Savings Dashboard
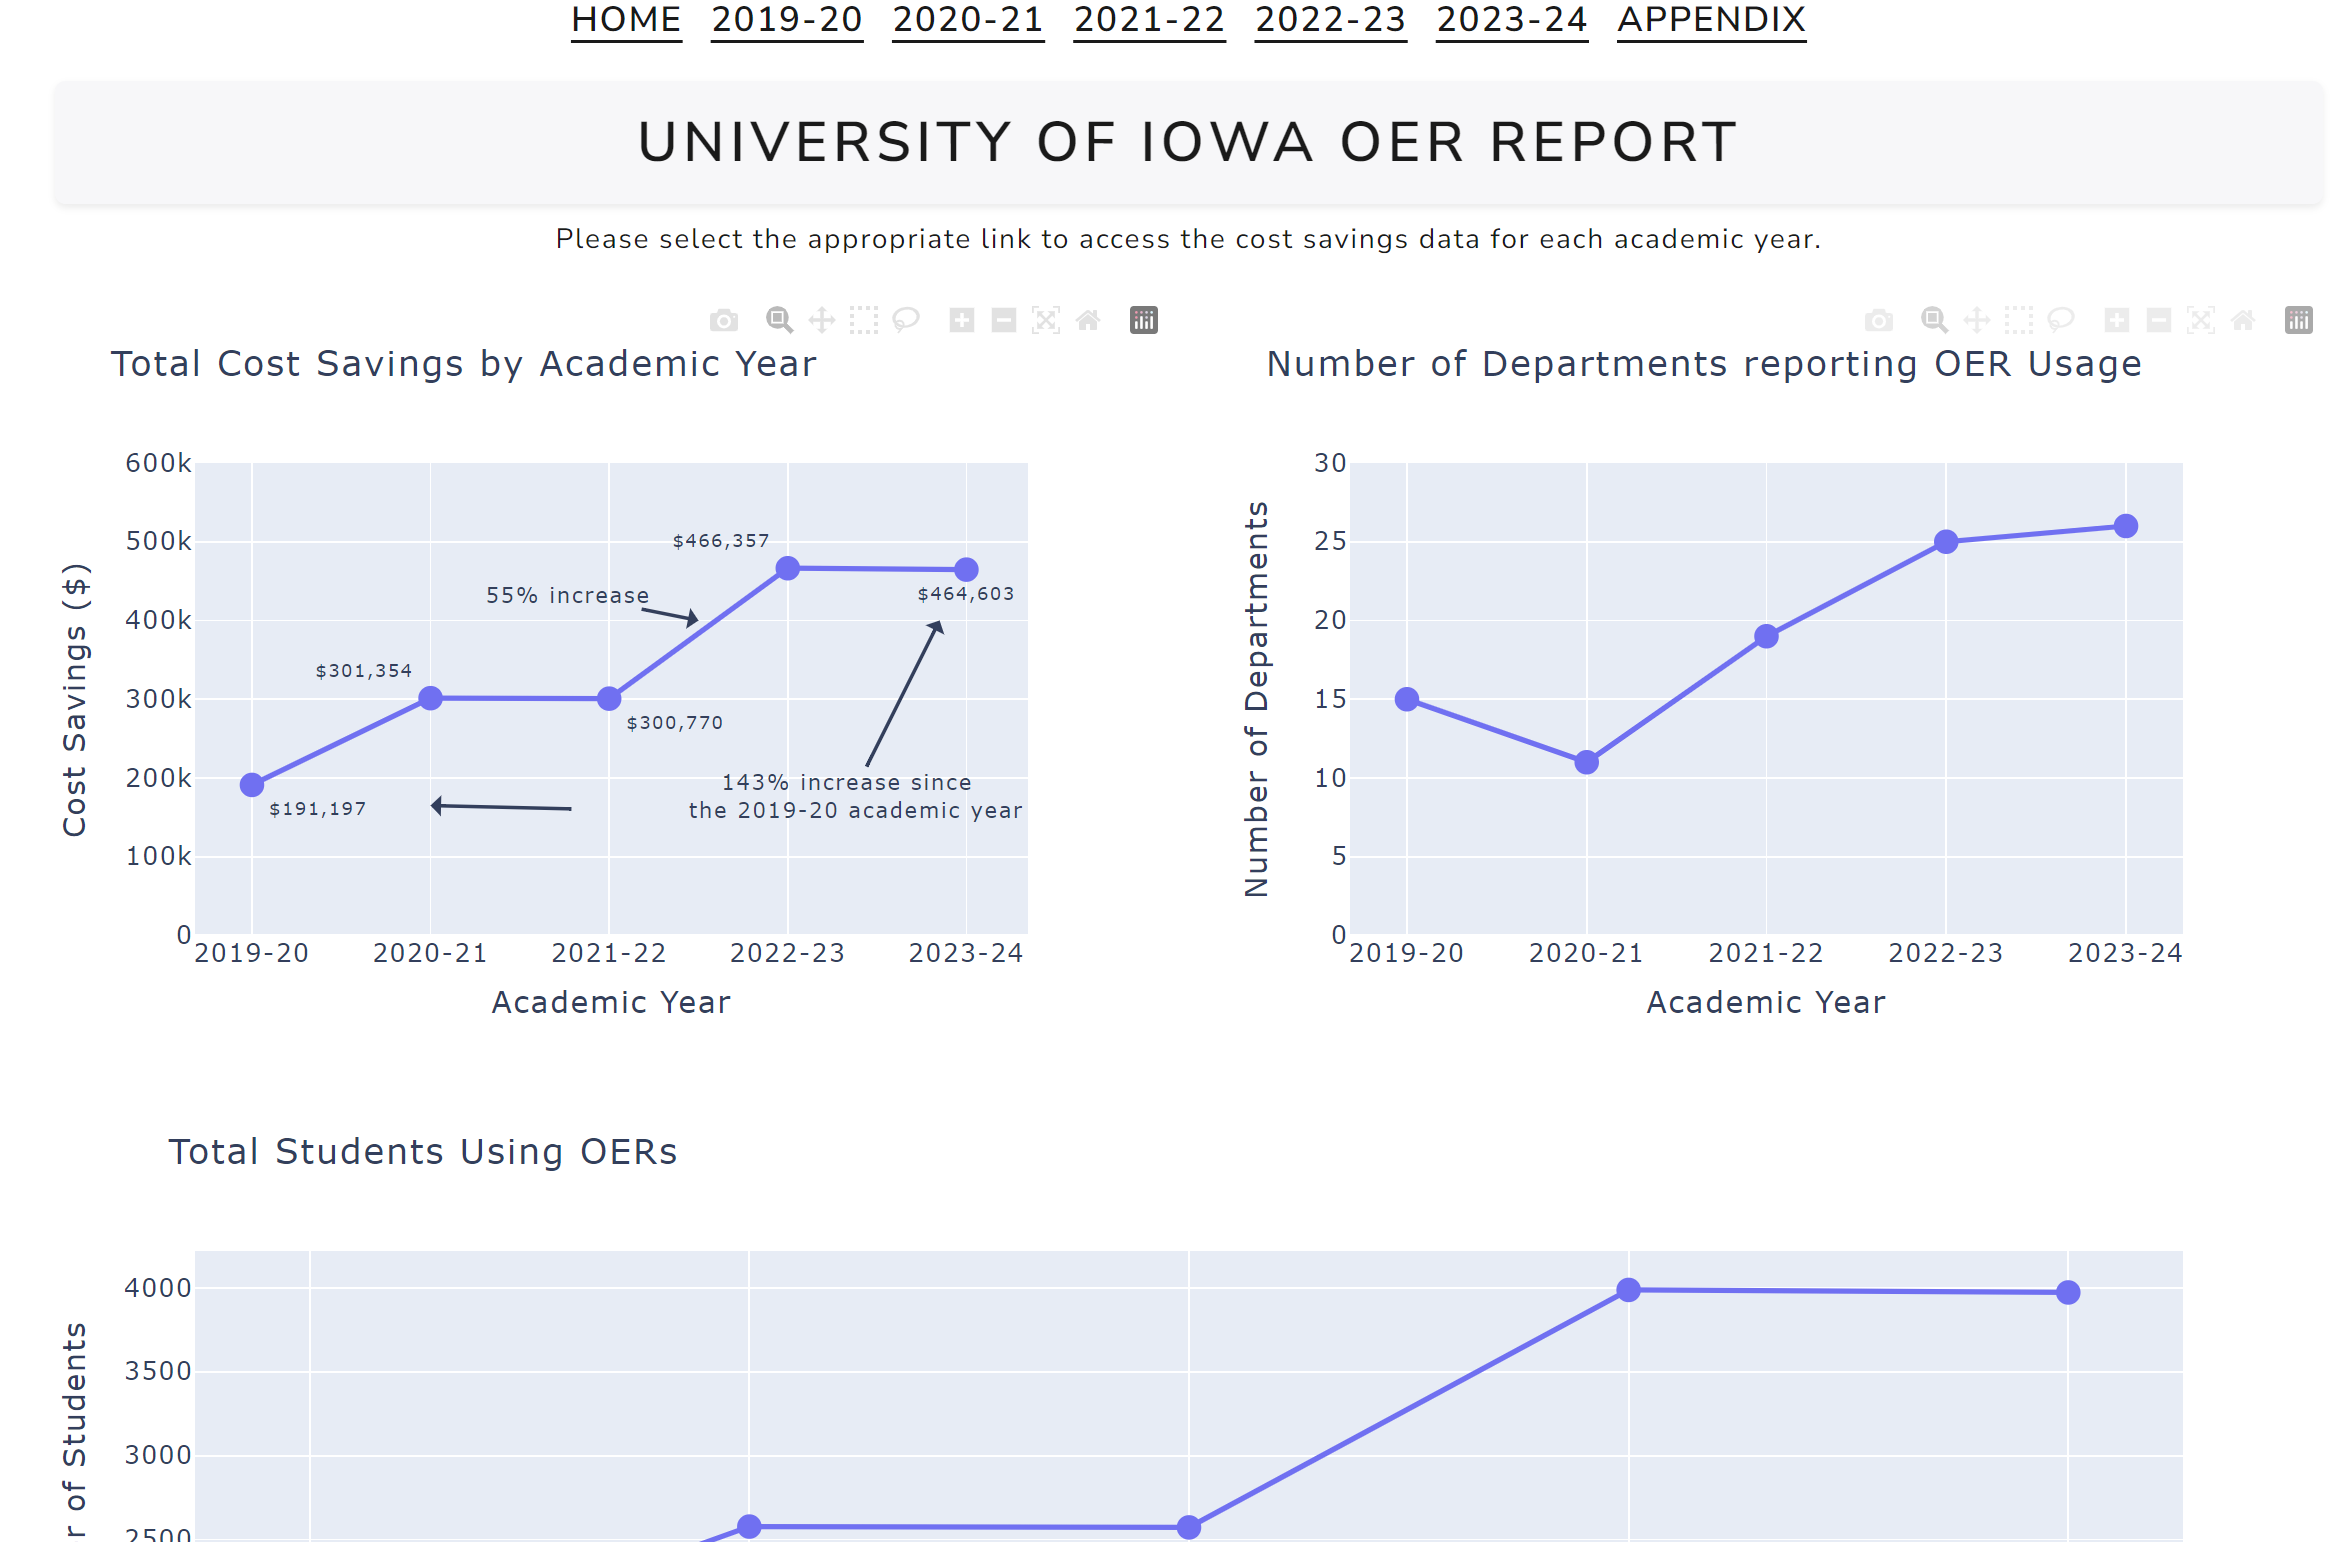
This is a product of my Spring 2024 practicum with the Scholarly Communications Librarian at the University of Iowa. I used Python, a framework called Dash, and Tableau to build this multi-page interactive dashboard. It currently is not hosted anywhere but I linked to the Github repository.
Python
Excel
Dash micro-framework
Bootstrap CSS library
Iowa OER Action Team survey results
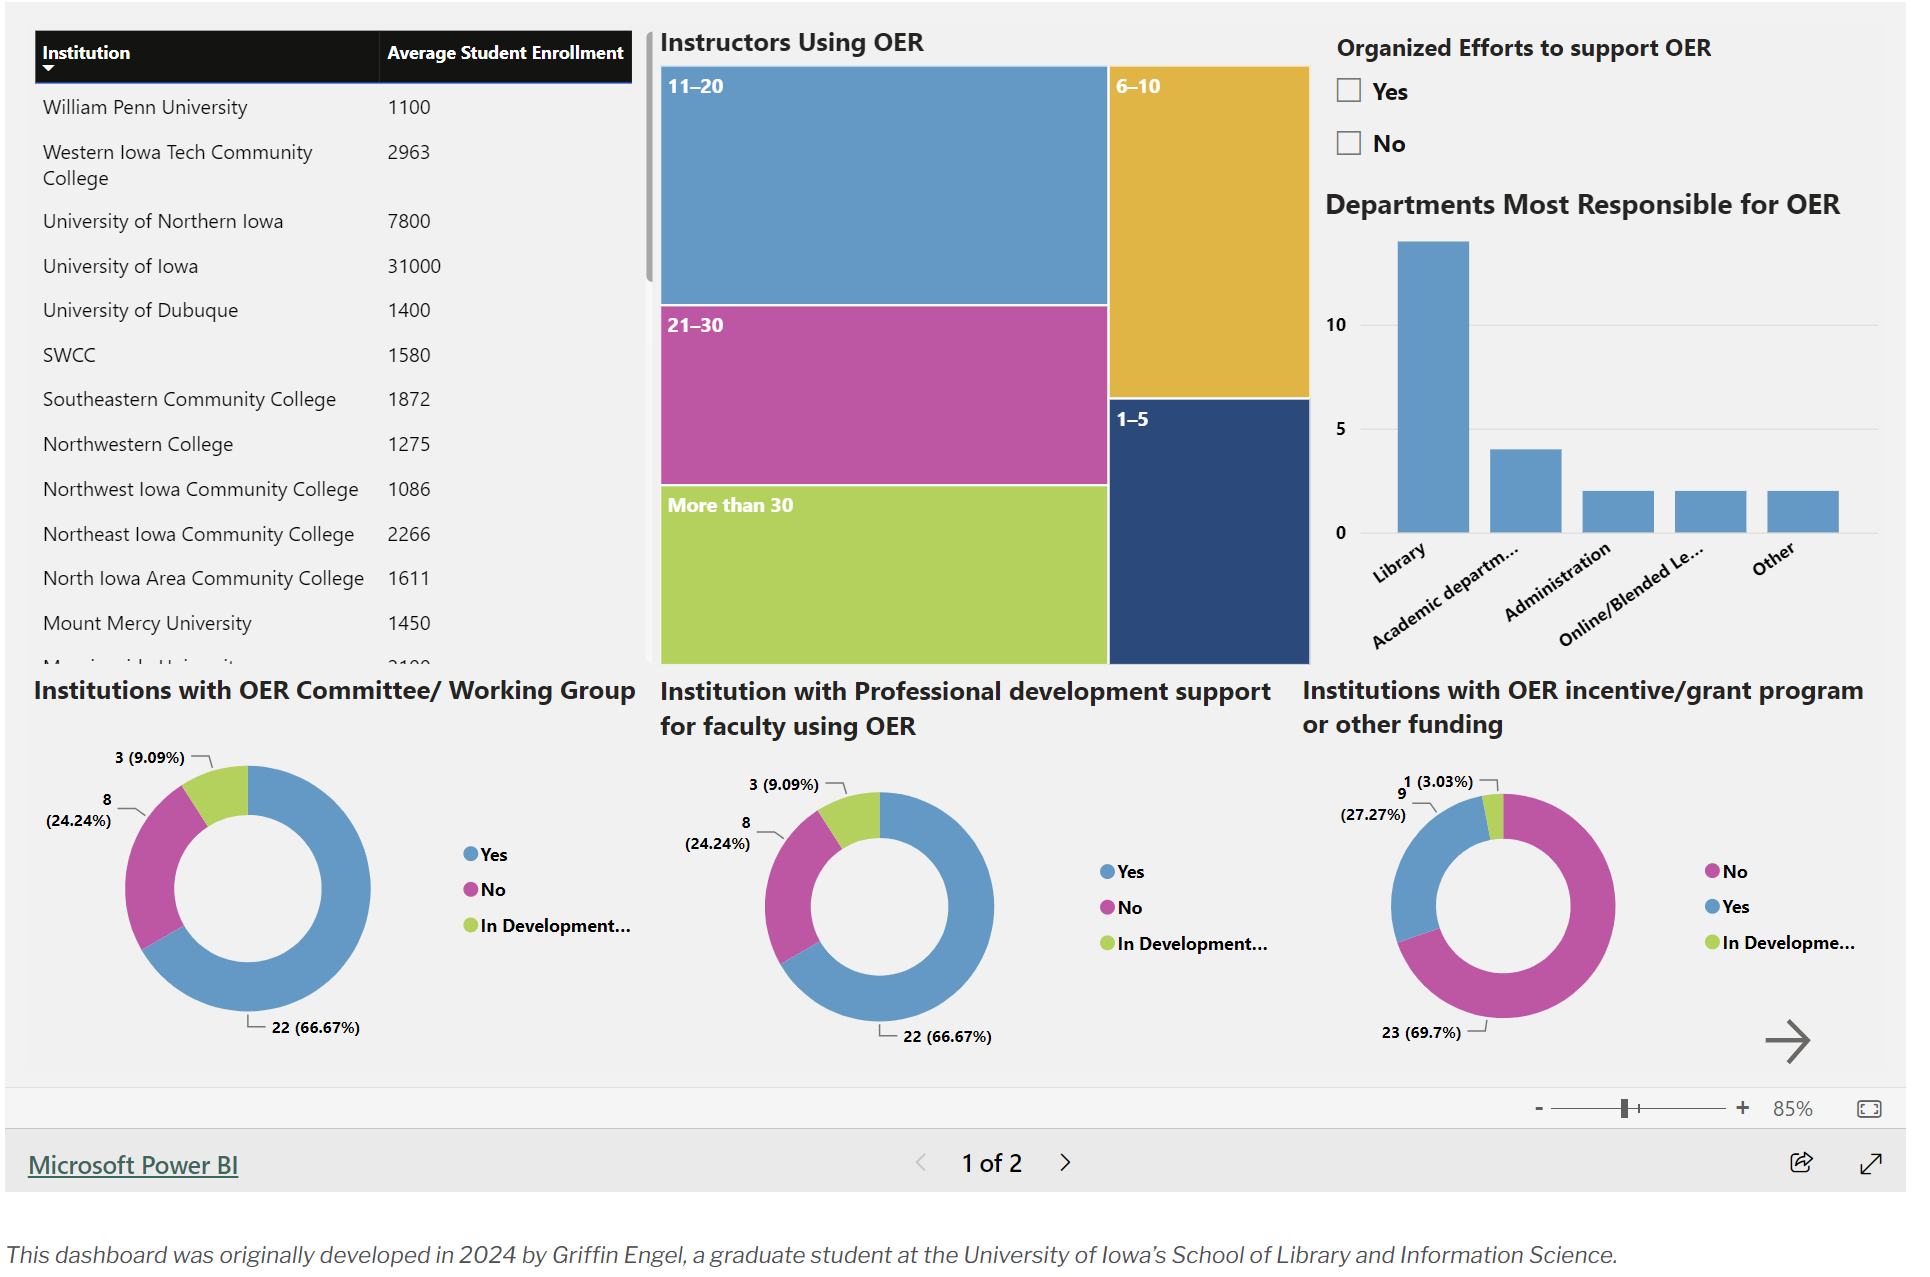
This PowerBI dashboard summarizes Iowa OER Action Team's 2023 survey results. Featured in the Midwestern Higher Education Compact Newsletter
Power BI
Excel
Health Insurance Charges Dashboard
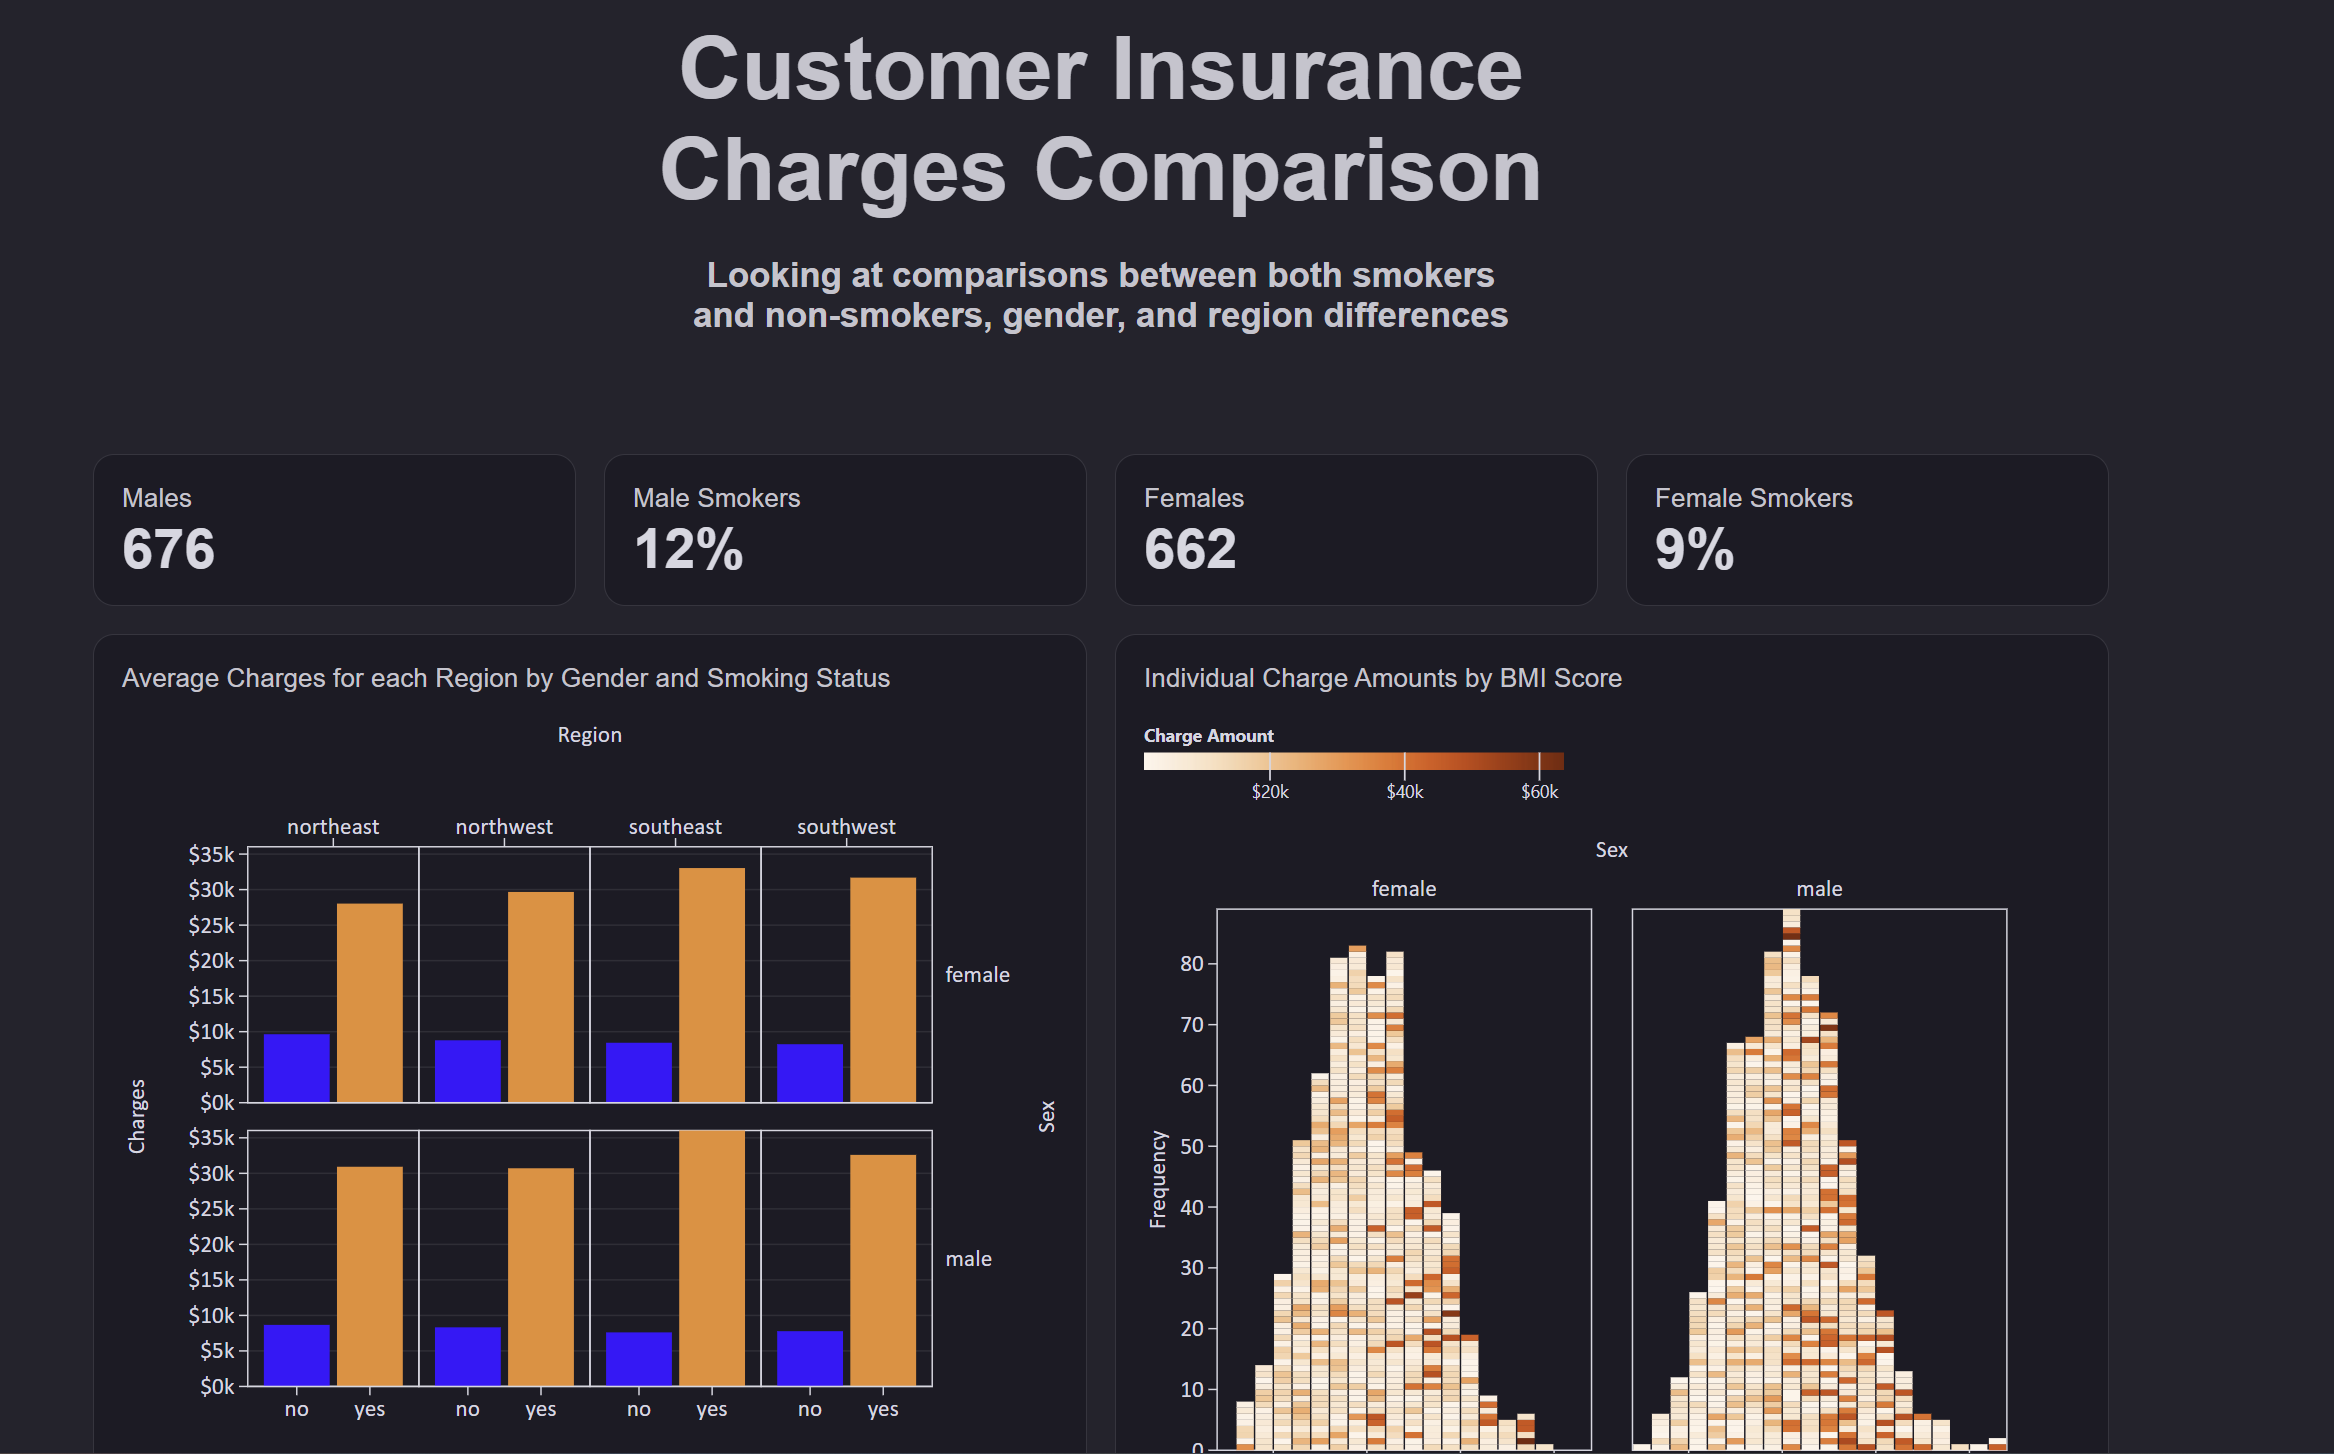
I made this to practice building and deploying a dashboard with Observable Framework. A JavaScript based framework for building data dashboards.
JavaScript
Observable Framework
Observable Notebooks
Percentage of California Counties Affected by wildfires between 2012 and 2022
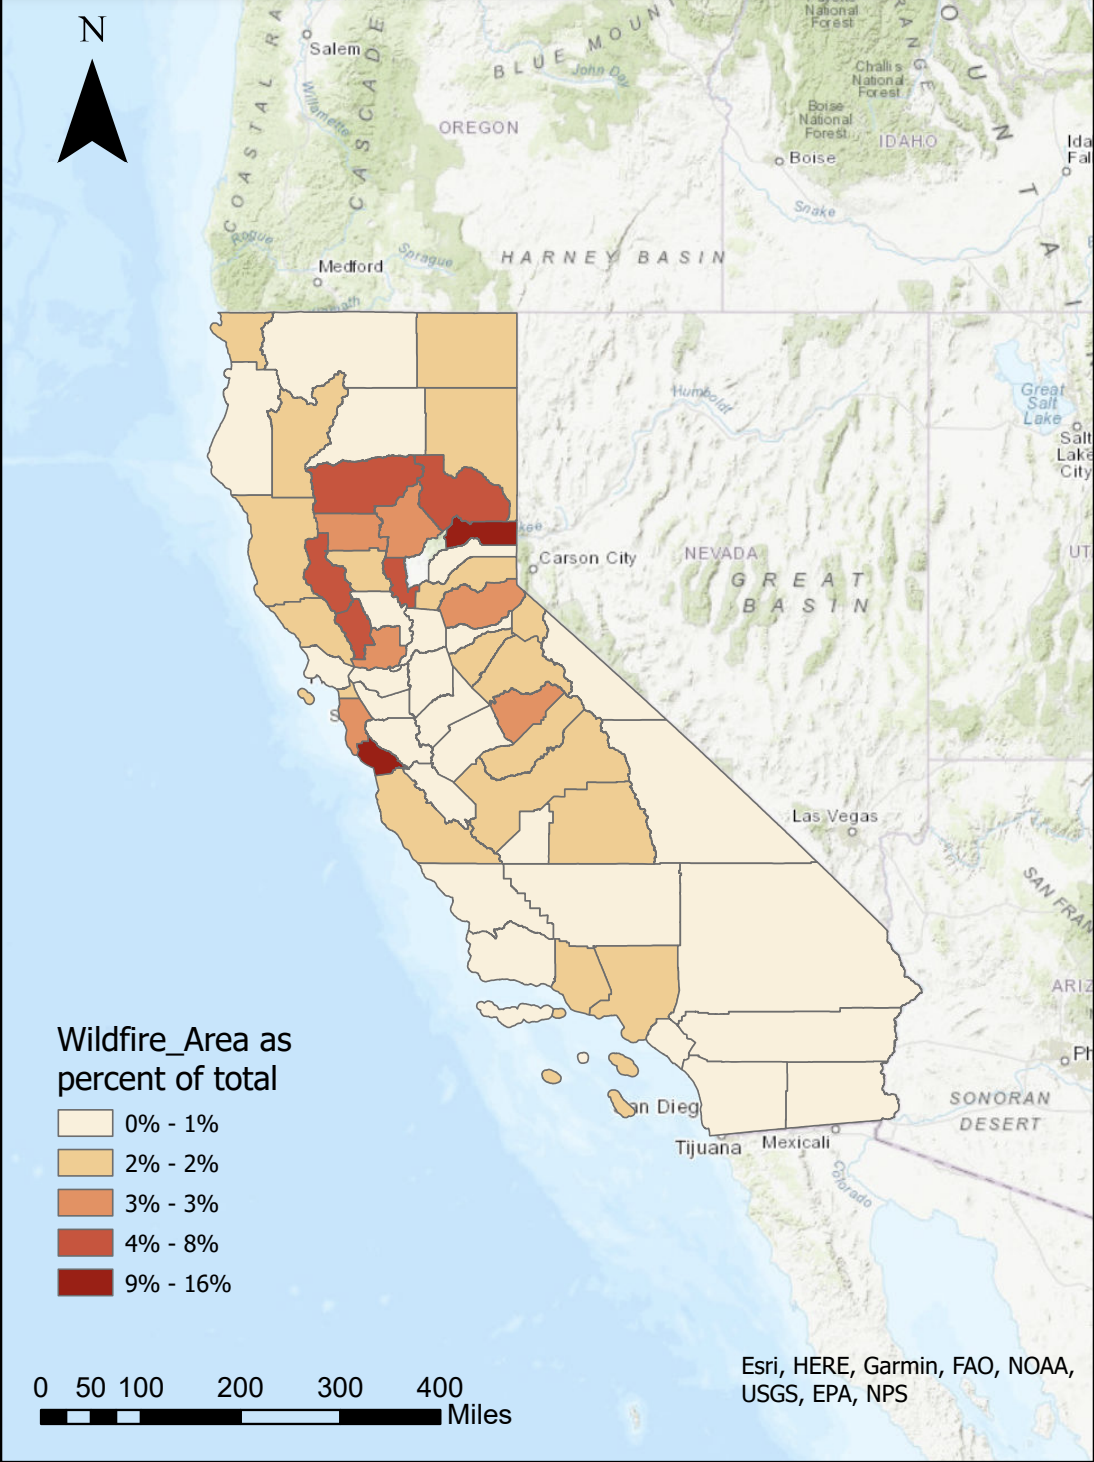
An ArcGIS project done as part of a Coursera course analyzing the percentage of California counties affected by wildfires between 2012 and 2022.
ArcGIS
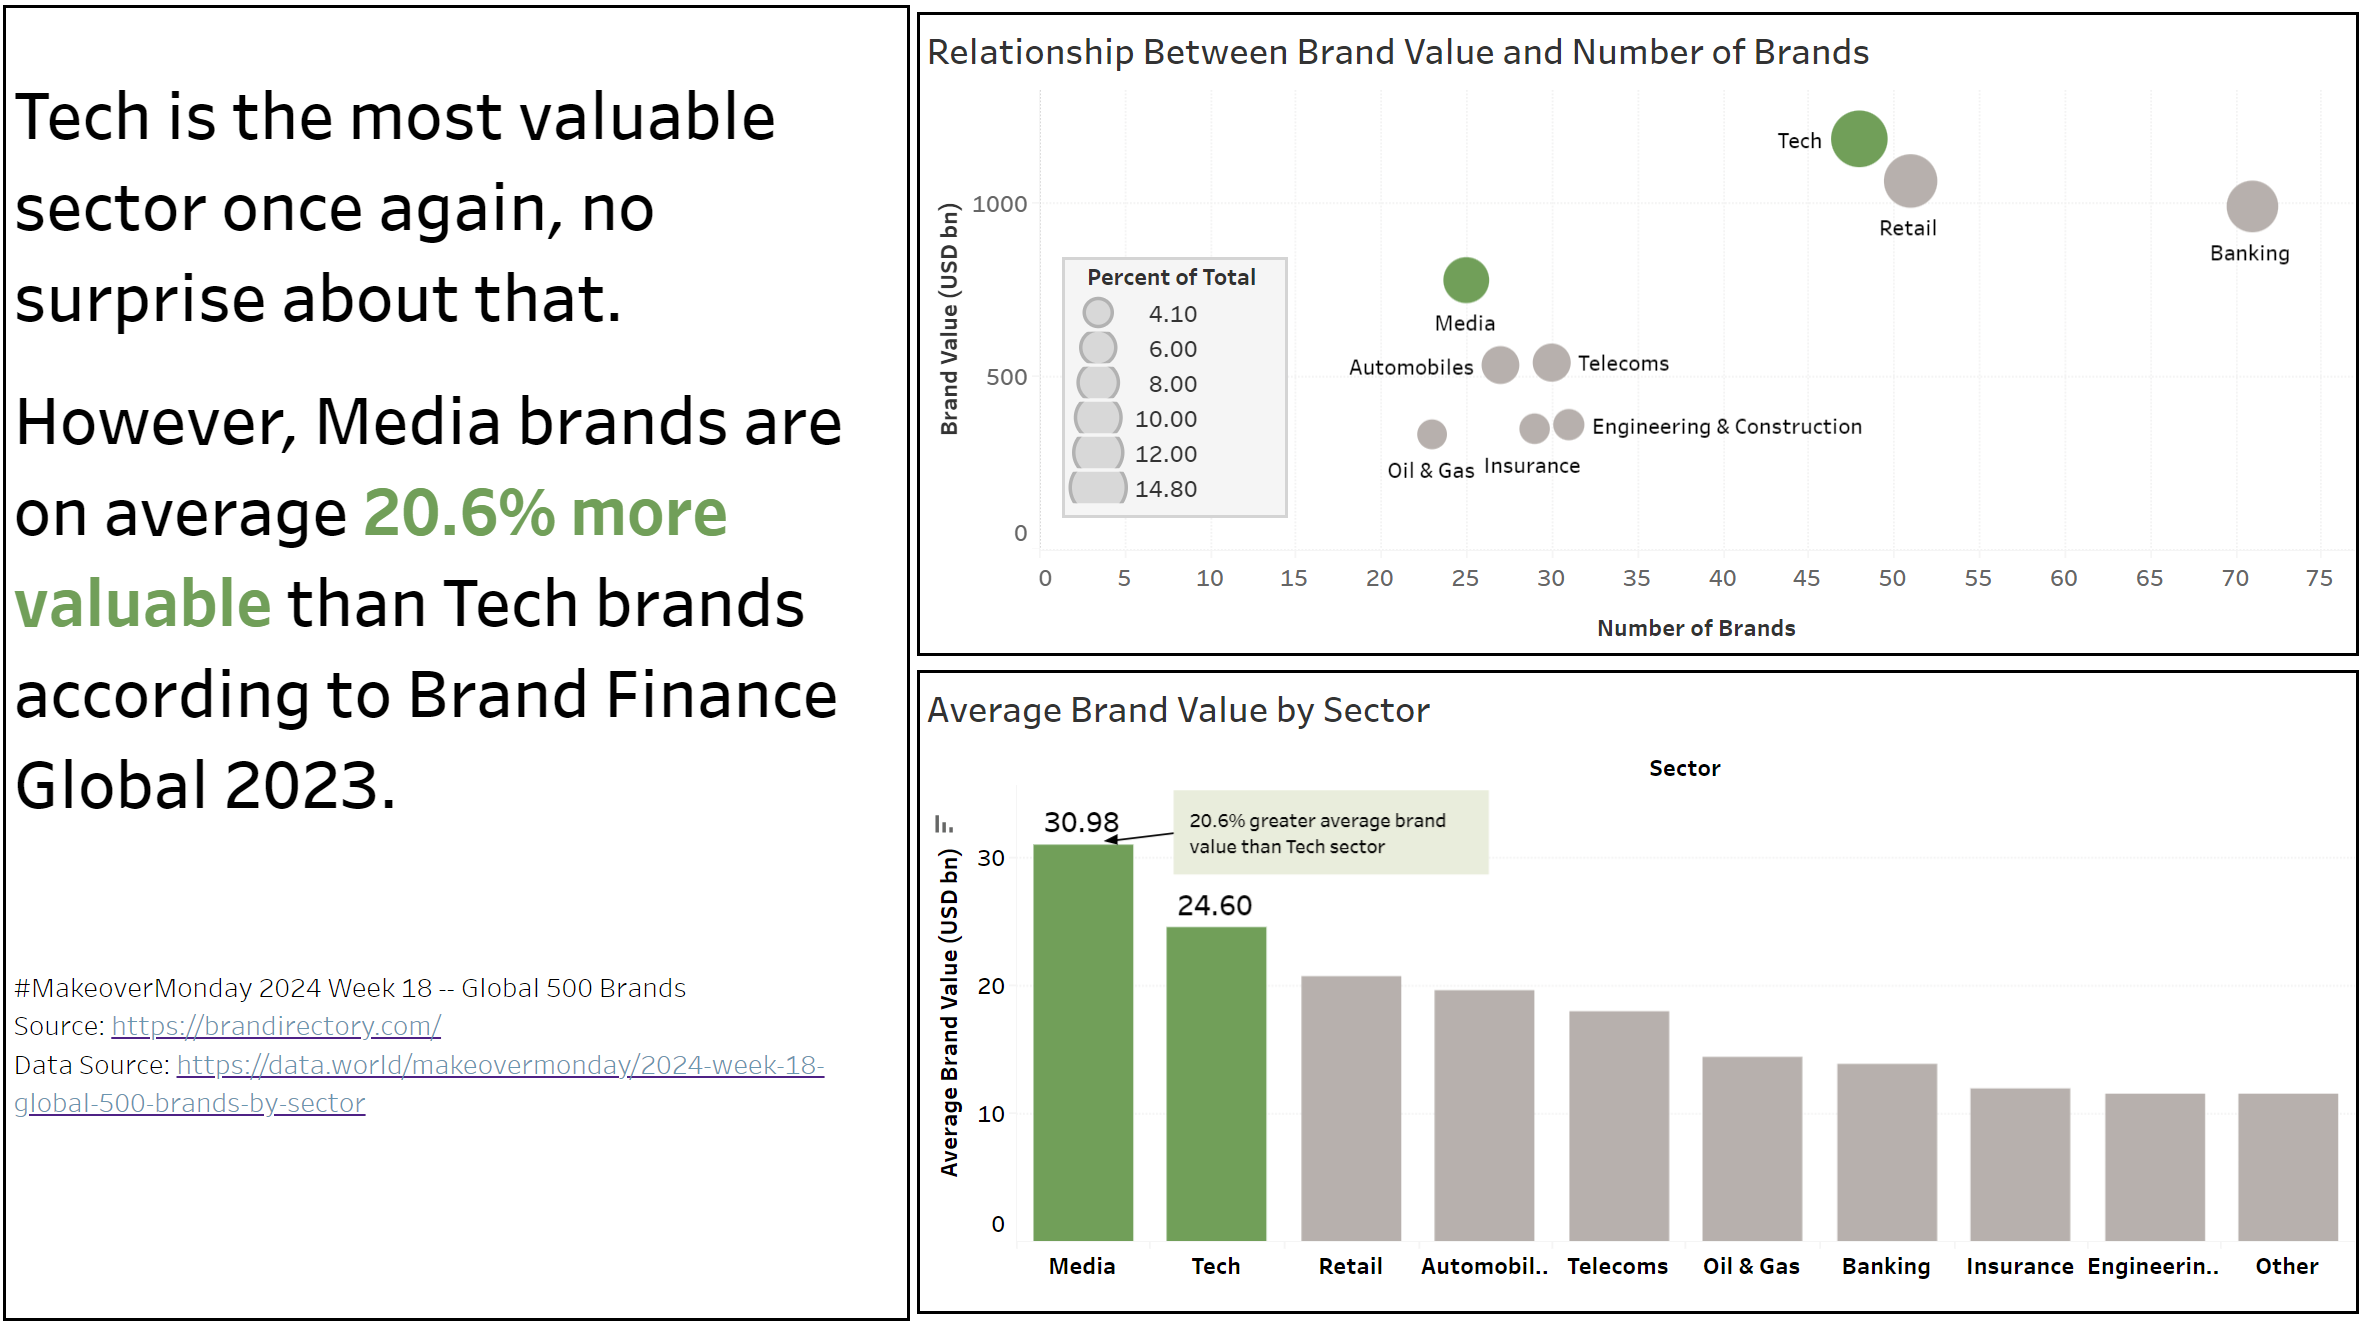
Global 500 Brands Value Analysis
This dashboard was a product of a #MakeoverMonday Challenge where an actual published visualization on a magazine or website is presented and one must present the data in their own way.
Tableau
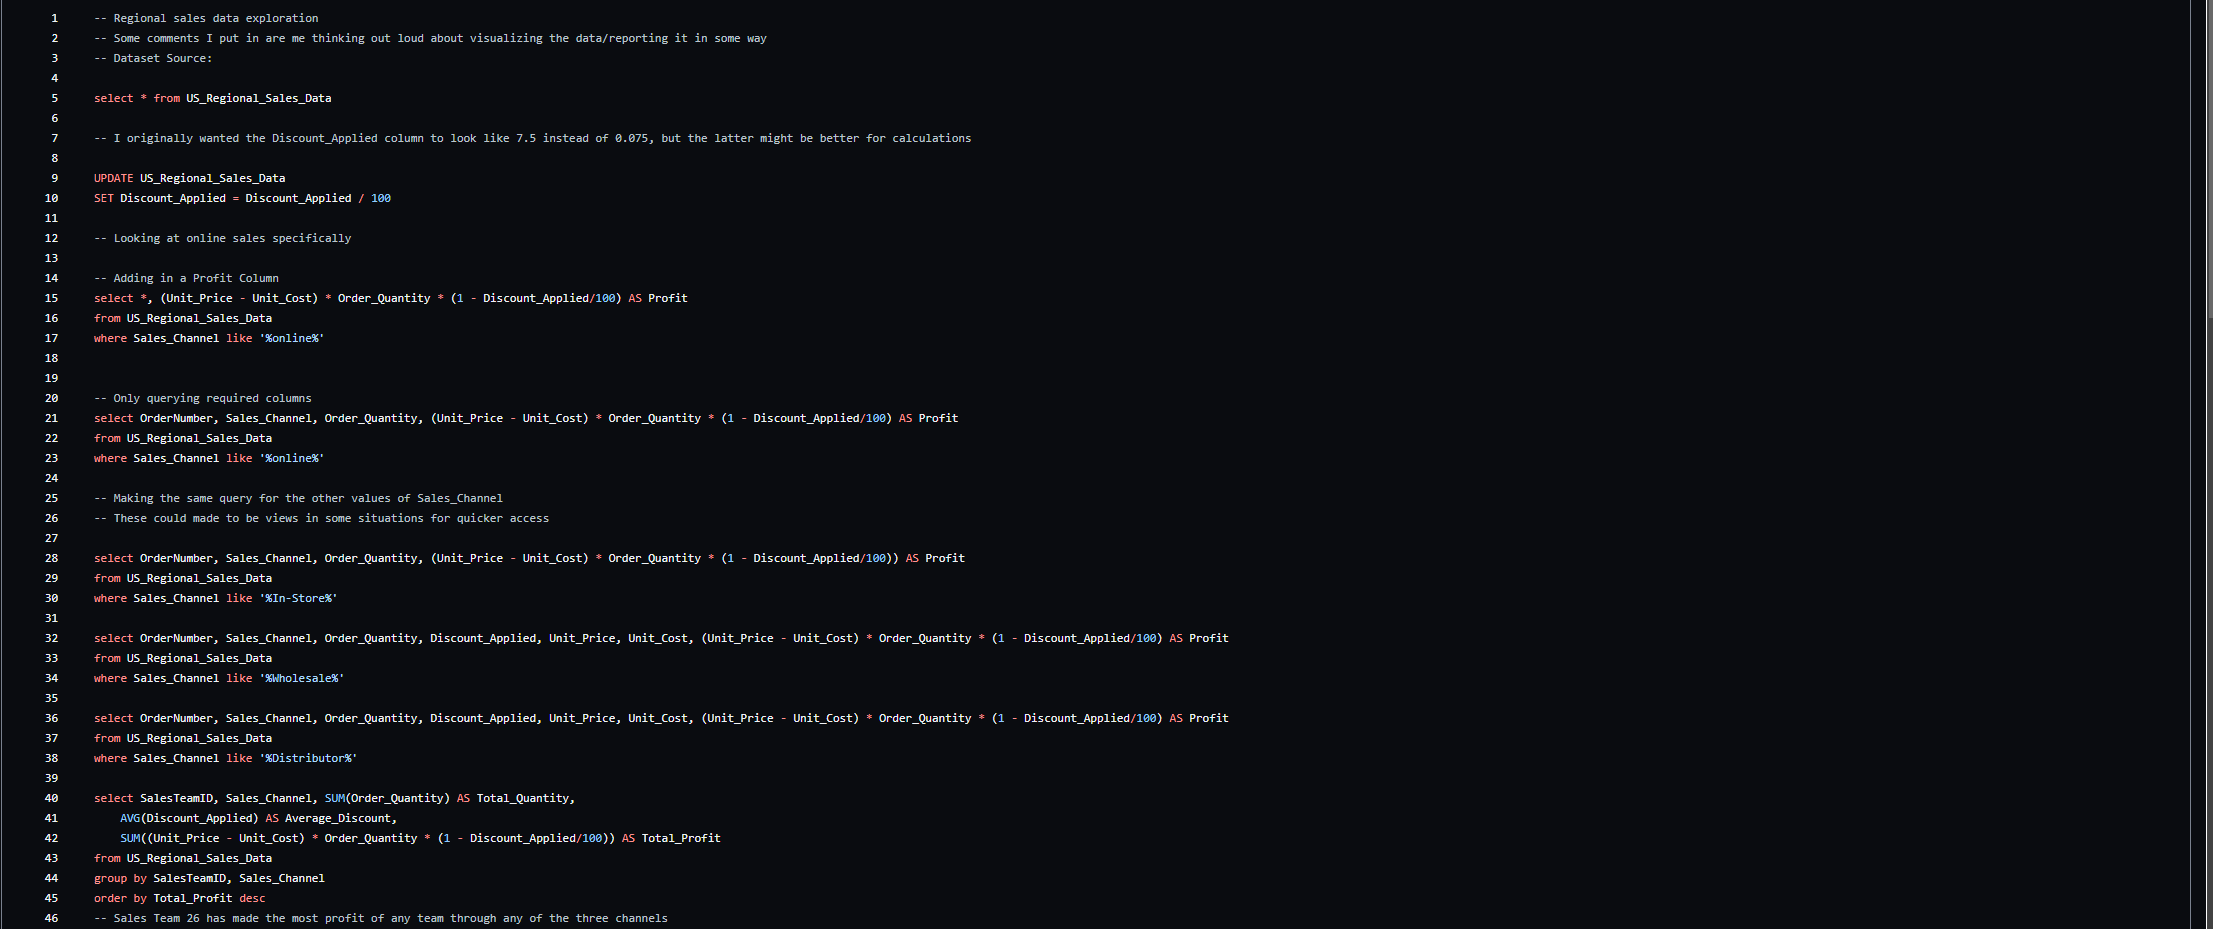
SQL Data Exploration
I found this dataset on Kaggle and thought it would be a good way to show an example of exploring a dataset with SQL Server.
SQL
SQL Server